Error Handling and Reporting in Applications

All applications have to deal with what to do with errors. An unexpected condition is bound to happen one rainy day no matter how good your QA is.

When a problem does happen, would your application display a meaningful message to a user or something to the tune of “A system error occurred. Try again later.”? Are application errors automatically monitored, collected, triaged, and reported to developers?

Handling of Expected and Unexpected Errors in Code

When a runtime error happens inside code it is encapsulated in some sort of an Exception object in languages with structured exception handling. The basic question to ask when handing it is whether the error is by its nature an unexpected error condition or not.

Unexpected error conditions are:

a) problems happening outside of your system control: for example, the network went down, the system password expired, memory ran out, etc.

b) defects in code

In both of these cases code receiving an unexpected error can’t do that much about it. Retry the call? Well, if the called code has a reproducible defect, you’re just going to reproduce it again. Retries might help with temporary outages: e.g. the database went down, but DBAs are busy restarting it right now. However, retries usually have a narrow scope of usefulness and are intrinsically limited: by the number of retires, time interval, user expecting a timely response, etc. Once the limit is reached, the retry logic has to be abandoned and we’re back to handling the original problem.

Error Swallowing Anti-Pattern

I’ve seen this anti-pattern in most projects and languages I dealt with:

// pseudo-code

try {
  doSomething(); // this call errors out
} catch (Exception) {
  // we're supposed to handle errors, right?
  // log some message, perhaps?

  // continuing... ?
}
// why do we end up here? the rest of the code might not expect this exceptional condition to have happened

This is what’s known as Error Swallowing. Sweeping under the rug, isn’t it? What happens when an error is “swallowed” could be quite unpredictable. Perhaps, a report rendered ends up with a blank space instead of a piece of data. This situation could lead to bad business decisions and outcomes beyond the immediate system issue.

Error Swallowing is a violation of an important technique in software development: Fail Fast (a.k.a. Fail Early).

Failing fast is a nonintuitive technique: “failing immediately and visibly” sounds like it would make your software more fragile, but it actually makes it more robust. Bugs are easier to find and fix, so fewer go into production.

Jim Shore, September/October 2004 IEEE SOFTWARE

This is an anti-pattern with the shortest fix imaginable: simply not doing this is often good enough of a fix.

// pseudo-code

doSomething(); // this call errors out
// unexpected errors propagate

Advice #1. Let unexpected errors propagate and fail the execution path fast.

Further discussion of the Error Swallowing anti-pattern could be found in Effective Java, 3rd Edition. Item 77: Don’t ignore exceptions.

Expected Errors and Exception Translation

Of course, some exceptional conditions could be expected by system developers. What if a user enters an invalid piece of data? The system ideally should validate all user input. If it really does then a good human-readable message should result. Inside layers of code, which handles expected exceptional conditions, the raised error should be specific to a particular failed condition. In the case of user input failing validation, there are 400 (Bad Request) and 403 (Forbidden) codes in HTTP. A RESTful service on the server side should return them with an error message payload. More generally, you can use e.g. java.lang.IllegalArgumentException in Java or System.ArgumentException in C#.

Should code intercept low-level exceptions and wrap them into higher-level exceptions? This practice is known as Exception Translation. The usefulness of such translation for unexpected exceptions could be limited. So what, if you wrapped DbPasswordExpiredException into ServiceUnavailableError? It would not make difference for an end user. The bottom line is that the system errors out unexpectedly because it broke internally.

Such a translation would make the most sense when you manage to expect a particular problem and display a meaningful message to the user. If you, say, anticipate an error in case a user’s credit card is valid, but over the limit or blocked, you can intercept a particular exception from a lower-level payment provider service, and translate it into a custom error, resulting in “Your credit card was declined. Please update your payment method.“.

Reporting of Unexpected Errors

From a system development perspective, developers should receive as much technical information as possible when unexpected errors happen. This could happen in one of two ways: either from the backend (think, error logs) or from user reports.

All errors could be logged; logs could be monitored and unexpected error reports could be extracted and sent to a developer team’s notification pipeline.

One thing to keep in mind when developing unexpected error notification pipeline is to avoid flooding developers with notifications:

  • consider implementing periodic (e.g. nightly) rather than real-time notifications
  • consider filtering out repeating errors which are caused by known (filed) defects

Advice #2. Monitor and report unexpected system errors in Production.

When an unexpected inevitably happens what should the user see?

Unexpected error report in macOS: iCal application

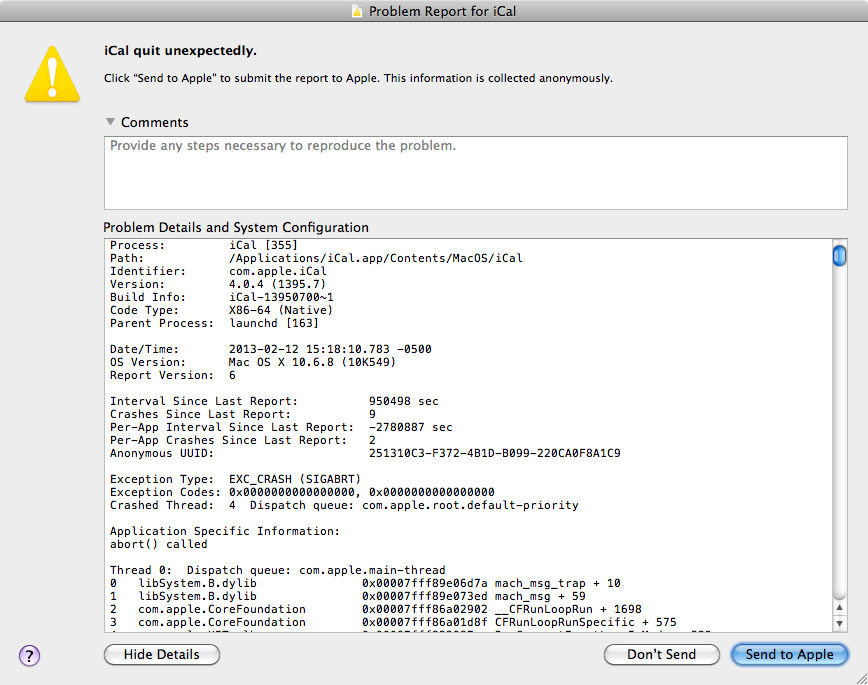
There are security guidelines that warn against showing technical details like this to users on the Internet because bad actors can make the system fail and then get clues out of technical details. This practice of “Error Detail Hiding” is a part of guidelines in the OWASP’s “Improper Error Handling” risk.

Error Detail Hiding though, if followed blindly, might have a large cost. The development feedback loop should better be as short as possible. The development loop is making a change, deploying code to a target environment, and then observing the result. When a system is being developed each error cause needs to be as obvious to developers as possible. While developers can often run the system on their machines (that is, in a Local environment) and just watch the error details in logs the same can’t be said about all other non-production environments.

Non-production environments are not available to end users and tend to be far less exposed to security risks. While security considerations are, obviously, important, each system architecture strikes some balance of functional, User Experience, and other requirements: performance, ease of maintenance, resilience, etc. While trying to strike that balance, keep in mind that Error Detail Hiding is quite detrimental to ease of maintenance and speed of development.

Advice #3. Integrate detailed error reporting into a system and always make technical error details immediately accessible in non-Production environments.

The Improper Error Handling risk used to be in the OWASP Top 10 risks (in 2003-2007) and people, understandably, were reticent to show error details in the apps. The risk is no longer there as of this writing (in the 2021 Top 10 version). It is not hard to guess why: for example, a basic technology stack can be detected without the arduous process of trying to make the system fail. BuiltWith, as of this writing detects 142 technologies used to run amazon.com.

But, what if you still want to minimize the risk? If robust error monitoring/reporting is in place on the backend, then it is fine to hide the details in production because developers would get reports anyway. But if you have nothing like that for your system, then Error Detail Hiding would substantially harm development productivity.

Advice #4. Only hide error details in Production when you have robust system error monitoring (per Advice #2) in place.

Advertisement

How slow can you go?

System performance testing is often done as a high-ceremony performed for major releases only.

  • Project on its own, designing:
    • Requirement Analysis and Gathering
    • PoC/Tool selection
    • Performance Test Plan
    • Performance Test Modeling
    • Test Execution
    • Test Analysis
  • Done in a Test environment designed similar to Production
    • Highly controlled environment
  • Aiming to produce high loads and hard results: numbers, pass/fail
  • Done by performance testing professionals

In today’s Agile and DevOps era teams are craving for rapid feedback and that certainly includes the impact of changes on system performance from one build to another. Performance testing can be done with reduced ceremony, continuously:

  • As a part of a build pipeline
  • In a lower-end Test environment
  • Aiming to produce build trends because results could be more volatile
  • Done by a DevOps team

Continuous Performance Testing is not difficult to set up on most projects. All you need is the following three ingredients, and each of them could be an open-source tool:

  1. Load Generator Tool
  2. Continuous Integration Server
  3. Chart Generator

The overall architecture (the big picture) of a solution relies on the usual Continuous Integration approach:


Load Generator Tools

Load generators can load a system-under-test with (HTTP) requests simulating the activity of virtual users. They support load logic (# of simulated clients, # of loops, spikes, fixed time testing, etc.) as well as simple scripting and assertion logic. Load generation could also be distributed to multiple machines.

Open source choices include:

  • Apache JMeter: a mature performance testing IDE. Tests are developed primarily via composition and configuration of JMeter components.
  • Gatling: Scala code-based tests, which can be generated recorder UI gene5
  • Locust: Python code-based tests

You can find a more comprehensive comparison here: Open Source Load Testing Tools: Which One Should You Use?

Commercial tools include LoadRunner, Telerik Test Studio and New Relic Synthetics. Notably, Microsoft performance testing offerings in Visual Studio Enterprise and Azure DevOps were deprecated in 2011 and Microsoft recommends a migration path to JMeter.

Finally, load generators can be hosted and used as a service. Offerings in this space include BlazeMeter and WebPagetest (a cross of performance testing and web page loading profiler).

Continuous Integration (CI) Servers

Jenkins is a popular open-source choice offering a wide variety of plug-ins, including chart generators. Any other CI server is also an option.

Chart Generators

The critical part of Continuous Performance Testing is providing feedback to the DevOps team, ideally, on every build. This could be done in the form of generated charts showing performance trends. This could be done by feeding raw output data (e.g. CSVs, XMLs) to dashboards. An easier solution to implement though is to use CI server built-in or third-party chart generation capabilities. There are two good options that can be used if you’re running Jenkins.

Jenkins Performance Plug-In

Jenkins Performance Plug-In can be used to chart runtime fo executed tets. It understands JMeter, JUnit and Taurus formats. Taurus is a wrapper around 20+ other load generators.

Usage Tips:

  • Use Advanced > Display Performance Report Per Test Case = on. This would chart one line per a performance test case (e.g. a JMeter Sampler) average data point.
  • Chart titles = data file names. You can omit .xml suffix and give files verbose names with spaces to use them as chart titles. Patterns containing spaces would be matched. For example, the build/jmeter-report/ * pattern would match any data file name that starts from space.
  • Performance Plug-in would publish reports only for data files found in the latest build. Data files previously found in builds, but not present in the latest build are ignored. If you want to start a fresh baseline, you can do this by simply renaming data file(s).
  • If there is a single data file, its charts are published on the main job page. If there are several reports, charts could be found on the job’s Performance Trend page, ordered by titles.
  • You have to have at least two builds in order to see trend charts. If you have a test, which was temporarily disabled or removed then re-enabled, you would need to have it in at least two builds in order to see a corresponding trend line.
  • Deleted builds are automatically removed from reports.
  • It is recommended to split reports containing more than 10-20 tests so that they are easier to read.


Jenkins Plot Plug-In

Jenkins Plot Plug-In can be used to chart arbitrary generated data. It’s useful for fixed-time performance tests generating, for example, Transactions Per Second (TPS) metrics.

Automate your Feature and Acceptance Tests in Four Easy Steps

Any significant web application at some point faces the question of how to approach testing of user-facing functionality. Developers could be (hopefully) happily churning out their JUnit-s, NUnit-s and Test::Unit-s, practicing TDD and Continuous Integration, but what does testing your classes, methods, and functions have to do with what your customers actually need from your system?

The answer is: not much, really. Testing web application from the end-user perspective involves dealing with test cases written in a business language, and secondly, firing multiple browsers and hunting down why this particular feature works perfectly fine in a browser Foo and does not work at all in a browser Baz. The right tools for automating this process are Behavior-Driven Development tools and browser “drivers”. These tools come from different development worlds and communities: Ruby, .NET, Java.

Fortunately, you can use many of these tools to test any web application regardless of your application platform whether it’s JavaEE, .NET, ColdFusion, PHP or Ruby on Rails. The tools came the long way since early days of Fit/Fitnesse and you can get from zero feature tests to automation in few easy steps using any desktop OS: Windows, Mac OS X or Linux. I promise.

What might be the most difficult part of this process is bewildering number of choices to make. A lot of choice is a Good Thing and all the tools mentioned in this post are free, open-source tools, but how it all fits together could be quite confusing. Fear not. Let’s walk through the steps.

Step 1. Select and Install a BDD Tool

Behavior-Driven Development is taking automated unit testing a level higher. The emphasis is on a language and readability of tests (or rather scenarios, broken down to steps in BDD parlance). One of the most active communities championing BDD tools is Ruby world. The framework that generated a lot of buzz in the last couple of years is Cucumber. It is a flexible Ruby framework that uses a wonderful domain-specific language for writing your scenarios: Gherkin. Gherkin is pretty much structured English or one of 37 other supported spoken languages. Cucumber natively uses Ruby for glue code (step definitions) that ties your features, scenarios and steps to browser drivers (or to native target applications).

Now, if you don’t know Ruby you might be tempted to go with one of Cucumber ports, for example cucumber-jvm (Java) or SpecFlow (.NET). You would get to write glue code in your programming language of choice, but the setup if often more complex, ports could be less mature or lagging behind flagship Ruby tools. It is hard to come up with other benefits of ports for testing web applications. Why not use this opportunity and learn a fun dynamic language with a lot of interesting ideas? It is used as the first language to teach kids, after all, and you don’t have to learn Rails and a lot of other Ruby frameworks, just the language itself.

My choice: Cucumber

Other choices: Fit/Fitnesse, SpecFlow, RSpec, easyb, etc.

What to do:

  • Windows: Install Ruby 1.8.x and add it to the PATH. Latest versions of Mac OS X come with Ruby 1.8.x. Don’t use Ruby 1.9.x just yet (see below).
  • Set RUBYOPT=-rubygems in your environment.
  • Go to your command line and install the Cucumber Ruby gem.
    >gem install cucumber

    Note: Any gem installation might fail with the following:
    ERROR: http://rubygems.org/ does not appear to be a repository
    This problem is transient. Try again in 5 minutes. Another option is to download needed .gem manually and install it:

    >cd {download directory}
    >gem install -lV cucumber

    The local installation (-l) will install Gem dependencies only if they are available in the Gem caches or in the local directory. You might need to download dependencies manually as well.

  • Windows: (optional, but highly recommended in order to display colored output) Install ANSICON.
  • Install RSpec for writing assertions in your glue code.
    >gem install rspec